
Hammer Candlesticks In Trading:
Nifty recently ended 95 points higher to cross above the key hurdle at the 19,850 level and form a hammer candlestick pattern on the daily chart.
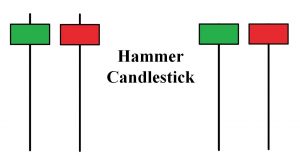
- Hammer Candlesticks in Trading is one of the most popular candlestick patterns traders use to gauge the probability of outcomes when looking at price movement.
- A hammer is a price pattern in candlestick charting that occurs when a security trades significantly lower than its opening but rallies within the period to close near the opening price.
- This pattern forms a hammer-shaped candlestick, in which the lower shadow is at least twice the size of the real body.
- The body of the candlestick represents the difference between the opening and closing prices, while the shadow shows the high and low prices for the period.
- The hammer candlestick occurs when sellers enter the market during a price decline. By the time the market closes, buyers absorb selling pressure and push the market price near the opening price.
- The close can be above or below the opening price, although the close should be near the open for the real body of the candlestick to remain small.
- Analysts view it as a potential bullish trend reversal indicator, mainly appearing at the end of a downtrend.
- It could be used as a leading intraday indicator to signal a change in bullish/bearish momentum.